Table of Contents
jQuery charts and graphs can transform a simple data into attractive
and interactive with colorful and make it interesting. A user can understand easily. JavaScript charts now famous for its attractive features and various types. These jQuery libraries have number of options to customize the data.
There are some libraries with drawing and vector graphics. Few charts and graphs help to use plugins for visualize your requirements. Some libraries come up with bubble diagrams, line graphs and bar graphs.
So just visit this article 10 jQuery Libraries for Interactive Charts and Graphs which will help to make a sense about your data customization.
isoChart
TufteGraph
Google Chart Tools
3D Pie Chart with JavaScript
3D Bar Chart with JavaScript
gRaphaël—JavaScript Library
GraphUp – jQuery Plugin
Google Chart Scroller/Zoomer
Highcharts JS
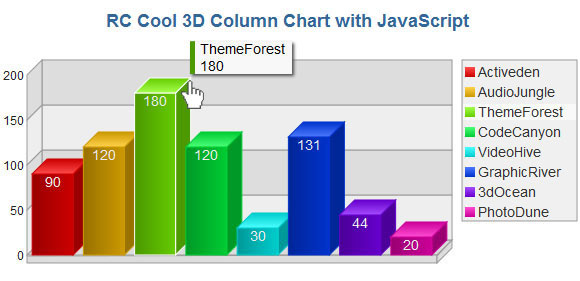
3D Column Chart with JavaScript

UI/UX Consultant, Photoshop, XD, SketchApp, Product Designer, Website Designer, Mobile App Designer, Expert WordPress Developer. For web/mobile design and wordpress development related projects please contact me at dibakar@themepurpose.com


