Table of Contents
The visual structures such as Graphs and Charts are a valuable presence in web development.
The visual structures can easily simplify complex data and output that can be chosen to put a list of JavaScript graphs. Today we present 10 such JavaScript solutions for Charts and Graphs to make easy your website development much easier.
JS Charts
JS Charts is a JavaScript chart generator that requires little or no coding. JS Charts allows you to easily create charts in different templates like bar charts, pie charts or simple line graphs. Moreover, JS Charts is free for non-commercial use.
jQuery Visualize
The Visualize plugin parses key content elements in a well-structured HTML table, and leverages that native HTML5 canvas drawing ability to transform them into a chart or graph visualization. For example, table row data values serve as chart bars, lines or pie wedges; table headers become value and legend labels; and the title and caption values provide title labels within the image.
Highcharts
Highcharts is a charting library written in pure JavaScript, offering an easy way of adding interactive charts to your web site or web application. Highcharts currently supports line, spline, area, areaspline, column, bar, pie and scatter chart types.
It works in all modern browsers including the iPhone/iPad and Internet Explorer from version 6. Standard browsers use SVG for the graphics rendering. In Internet Explorer graphics are drawn using VML.
jqPlot
Computation and drawing of lines, axes, shadows even the grid itself is handled by pluggable “renderers”. Not only are the plot elements customizable, plugins can expand functionality of the plot too! There are plenty of hooks into the core jqPlot code allowing for custom event handlers, creation of new plot types, adding canvases to the plot, and more!
TufteGraph
It is different from other javascript charting libraries because:
a) Configuration is by dynamic functions, allowing for a really compact API (very few options).
b) Non-core layout is done via CSS rather than code.
PlotKit
PlotKit is a Chart and Graph Plotting Library for Javascript. It has support for HTML Canvas and also SVG via Adobe SVG Viewer and native browser support.
jQuery Sparklines
This jQuery plugin generates sparklines (small inline charts) directly in the browser using data supplied either inline in the HTML, or via javascript. The plugin is compatible with most modern browsers and has been tested with Firefox 2+, Safari 3+, Opera 9, Google Chrome and Internet Explorer 6, 7 & 8.
Raphaël
Raphaël is a small JavaScript library that should simplify your work with vector graphics on the web. If you want to create your own specific chart or image crop and rotate widget, for example, you can achieve it simply and easily with this library.
Canvas 3D Graph
Canvas 3D Graph is a special type of bar graph that plot numbers in 3D.
Protovis
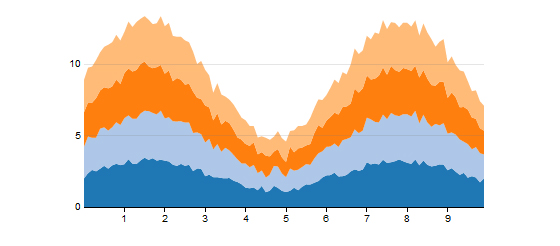
Protovis is designed for custom visualization, it is still easy to create many standard chart types. These simpler examples serve as an introduction to the language, demonstrating key abstractions such as quantitative and ordinal scales, while hinting at more advanced features, including stack layout.

UI/UX Consultant, Photoshop, XD, SketchApp, Product Designer, Website Designer, Mobile App Designer, Expert WordPress Developer. For web/mobile design and wordpress development related projects please contact me at dibakar@themepurpose.com


